6. Color
Warm-up
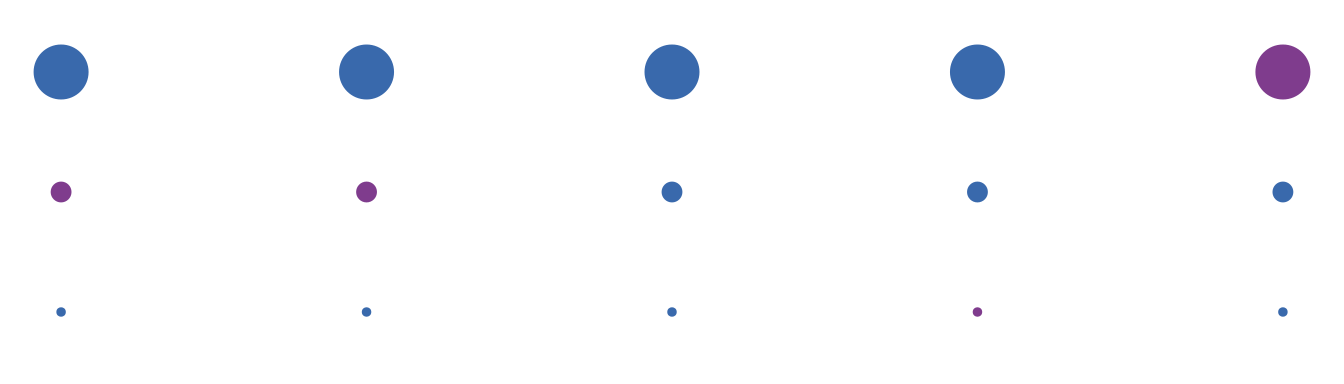
Color perception
Which row uses a darker color?

Which line uses a darker color?

Which line uses a darker color?

How many purple dots are in each row?
Colors in R
If you don’t already have a color selection tool on your computer 1 you can install the colourpicker package that has a color picker addin for RStudio.
1 Maybe the thing I miss most since switching from Mac to Linux is the color picker app Sip, definitely recommend it
Chapters
We’ll walk through Wilke chapters 4 and 19–I don’t have a ton to add until we get to mapping.
- Wilke chapter 4
- Wilke chapter 19
- Datawrapper (2021)
Tools
- ColorBrewer (access to these palettes comes with ggplot)
- Carto Colors (access comes with the rcartocolor package)
- Viz Palette generator & preview
- Gregor Aisch’s chroma palettes generator
- Colorgorical categorical color generator 2
2 I just read a post making fun of Colorgorical for leaning toward puke green colors; haven’t used it in a while but heads up I guess?
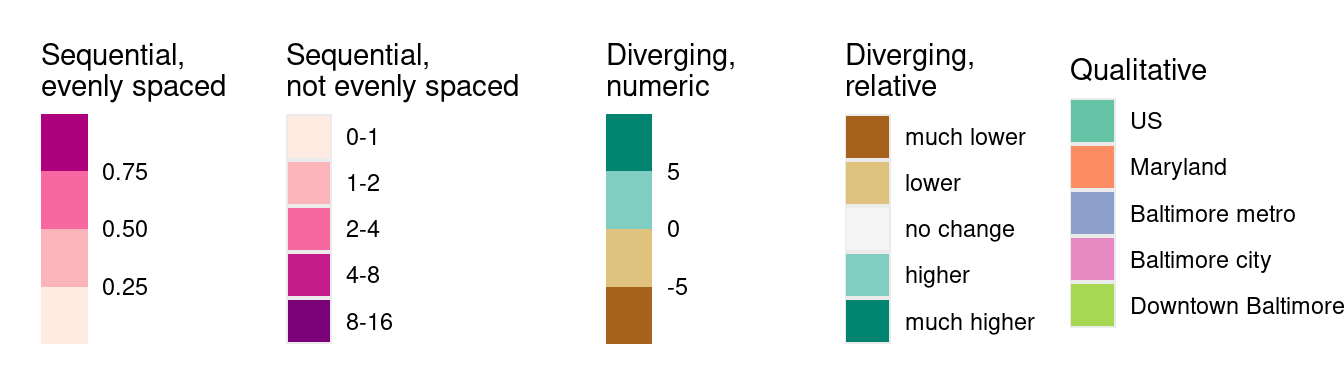
Types of color palettes
The main types of color palettes are:
- sequential / quantitative: values are numeric and continuous; values and colors (saturation, lightness, hue) increase in some way in tandem
- diverging: values are likely numeric, but colors trend in opposite directions
- qualitative / categorical: values are not numeric / continuous, and colors should not imply continuity
ColorBrewer and Carto Colors are great because they have options for all three of these.
These are rough examples using ColorBrewer palettes; in practice you might want to make some adjustments to these.
Exercises
local_counties <- c("Baltimore city", "Baltimore County", "Harford County", "Howard County", "Anne Arundel County")
acs_county <- acs |>
  filter(level %in% c("us", "state", "county")) |>
  mutate(local1 = forcats::as_factor(name) |>
           forcats::fct_other(keep = c(local_counties, "United States", "Maryland"), other_level = "Other counties"),
         local2 = forcats::fct_collapse(local1, "Outside Baltimore" = c("Baltimore County", "Harford County", "Howard County", "Anne Arundel County")) |>
           forcats::fct_relevel("Outside Baltimore", "Other counties", after = Inf))

theme_set(theme_nice())
knitr::kable(head(acs_county))| level | county | name | total_pop | white | black | latino | asian | other_race | diversity_idx | foreign_born | total_hh | homeownership | total_cost_burden | total_severe_cost_burden | owner_cost_burden | owner_severe_cost_burden | renter_cost_burden | renter_severe_cost_burden | no_vehicle_hh | median_hh_income | ages25plus | less_than_high_school | high_school_grad | some_college_or_aa | bachelors | grad_degree | pov_status_determined | poverty | low_income | area_sqmi | pop_density | local1 | local2 |
|---|---|---|---|---|---|---|---|---|---|---|---|---|---|---|---|---|---|---|---|---|---|---|---|---|---|---|---|---|---|---|---|---|---|
| us | NA | United States | 331097593 | 0.59 | 0.12 | 0.19 | 0.06 | 0.05 | 0.7376547 | 0.14 | 125736353 | 0.65 | 0.29 | 0.14 | 0.21 | 0.09 | 0.45 | 0.23 | 0.08 | 75149 | 226600992 | 0.11 | 0.26 | 0.28 | 0.21 | 0.13 | 323275448 | 0.13 | 0.29 | NA | NA | United States | United States |
| state | NA | Maryland | 6161707 | 0.49 | 0.29 | 0.11 | 0.06 | 0.05 | 0.7905359 | 0.16 | 2318124 | 0.67 | 0.29 | 0.13 | 0.21 | 0.09 | 0.46 | 0.23 | 0.09 | 98461 | 4260095 | 0.09 | 0.24 | 0.25 | 0.22 | 0.20 | 6034320 | 0.09 | 0.21 | NA | NA | Maryland | Maryland |
| county | NA | Allegany County | 68161 | 0.87 | 0.07 | 0.02 | 0.01 | 0.03 | 0.3379538 | 0.02 | 27462 | 0.70 | 0.23 | 0.10 | 0.16 | 0.07 | 0.39 | 0.17 | 0.10 | 55248 | 47914 | 0.09 | 0.41 | 0.29 | 0.12 | 0.09 | 61098 | 0.16 | 0.36 | 422.19881 | 161.4429 | Other counties | Other counties |
| county | NA | Anne Arundel County | 588109 | 0.65 | 0.17 | 0.09 | 0.04 | 0.05 | 0.6745018 | 0.09 | 221704 | 0.75 | 0.26 | 0.11 | 0.20 | 0.08 | 0.44 | 0.19 | 0.04 | 116009 | 409052 | 0.06 | 0.22 | 0.27 | 0.25 | 0.19 | 577547 | 0.06 | 0.14 | 414.80643 | 1417.7914 | Anne Arundel County | Outside Baltimore |
| county | NA | Baltimore County | 850737 | 0.54 | 0.30 | 0.06 | 0.06 | 0.04 | 0.7241974 | 0.12 | 328611 | 0.67 | 0.29 | 0.14 | 0.20 | 0.09 | 0.48 | 0.24 | 0.08 | 88157 | 589611 | 0.08 | 0.24 | 0.26 | 0.23 | 0.18 | 830921 | 0.10 | 0.23 | 598.35821 | 1421.7855 | Baltimore County | Outside Baltimore |
| county | NA | Baltimore city | 584548 | 0.27 | 0.61 | 0.06 | 0.03 | 0.04 | 0.6483744 | 0.08 | 247232 | 0.48 | 0.37 | 0.19 | 0.26 | 0.13 | 0.47 | 0.26 | 0.26 | 58349 | 410221 | 0.13 | 0.28 | 0.24 | 0.18 | 0.17 | 564634 | 0.20 | 0.38 | 80.94606 | 7221.4510 | Baltimore city | Baltimore city |
Find some ways to improve the use of color in these charts, including whether color even should be used. Before writing any code, write down:
- How color is used / what color signifies
- What’s wrong with that use of color
- How you want to change it
Here are some charts that are bad because they use color inappropriately.
acs_county |>
  mutate(name = forcats::as_factor(name) |> forcats::fct_reorder(homeownership)) |>
  ggplot(aes(x = name, y = homeownership, fill = name)) +
  geom_col(width = 0.8) +
  coord_flip() +
  labs(x = NULL, y = NULL,
       title = "Homeownership rate by location",
       subtitle = "US, Maryland, and Maryland counties, 2022")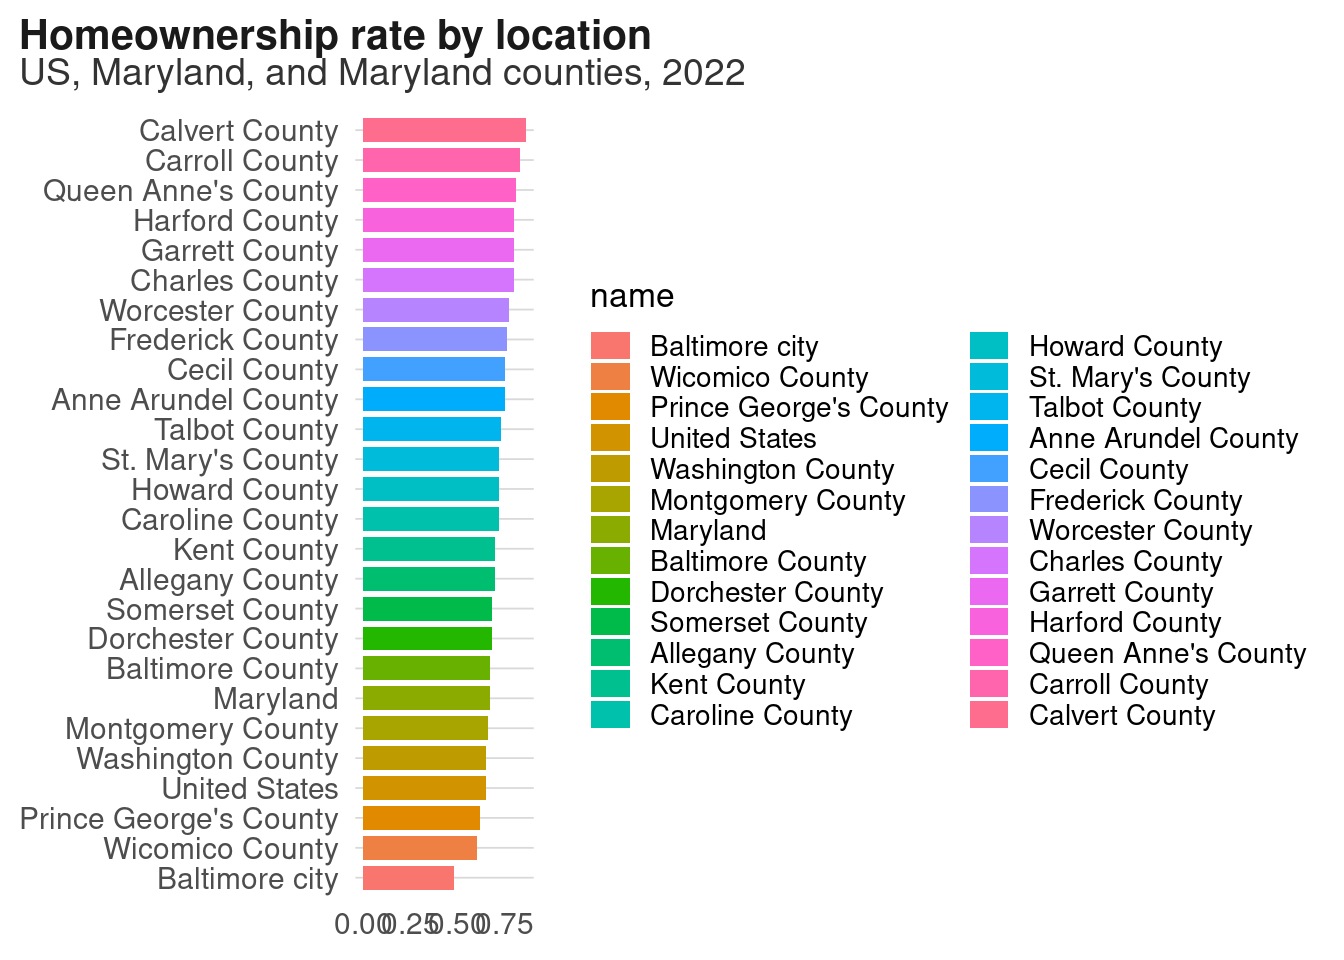
acs_county |>
  mutate(name = forcats::as_factor(name) |> forcats::fct_reorder(homeownership)) |>
  ggplot(aes(x = name, y = homeownership, fill = local2)) +
  geom_col(width = 0.7, color = "gray20", linewidth = 0.2) +
  coord_flip() +
  labs(x = NULL, y = NULL,
       title = "Homeownership rate by location",
       subtitle = "US, Maryland, and Maryland counties, 2022") +
  scale_fill_brewer(palette = "GnBu")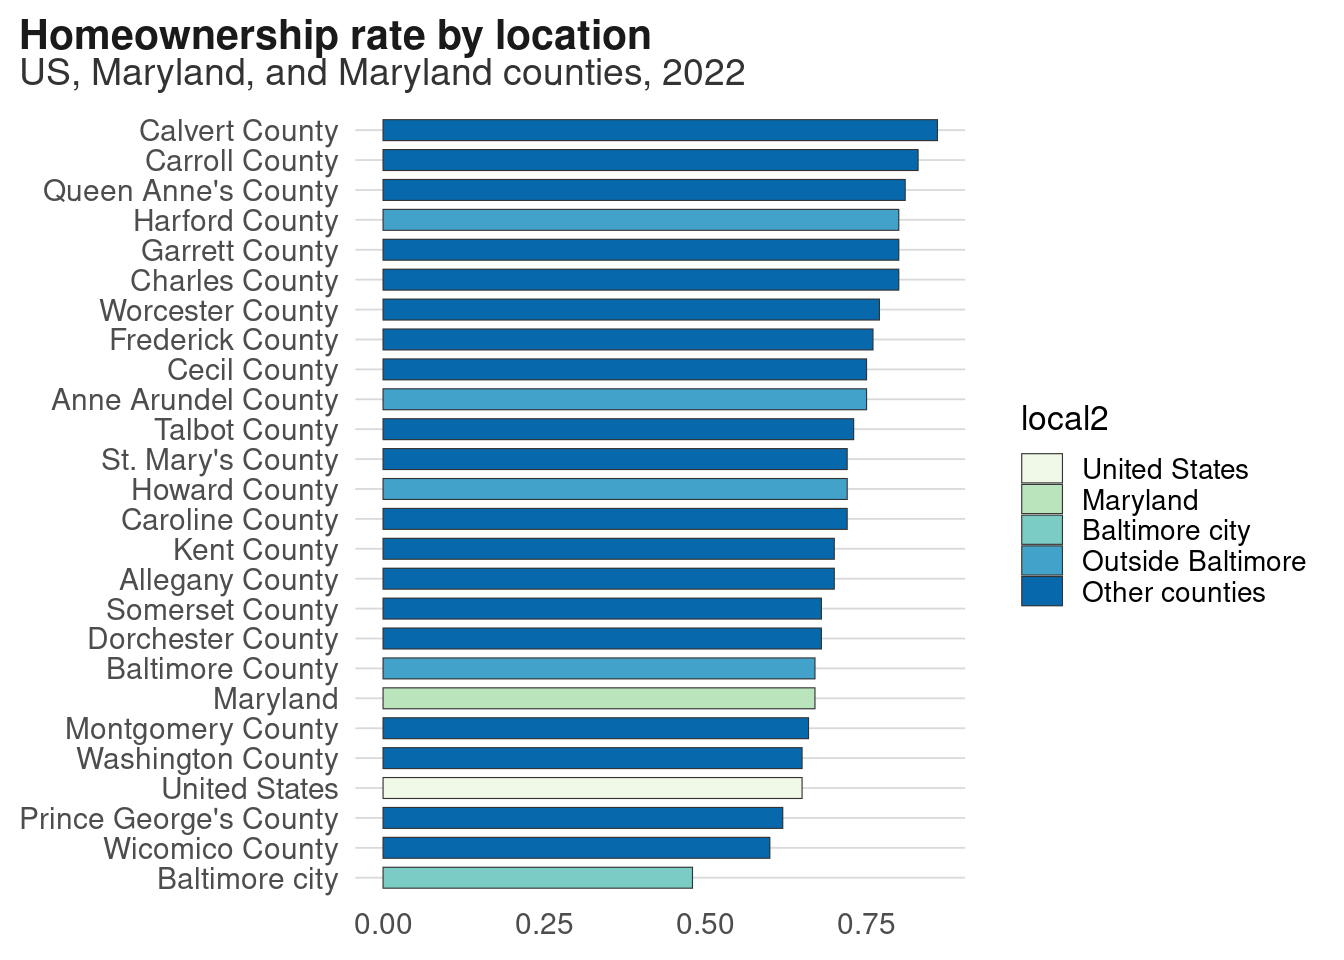
Here’s a chart that’s okay but not great; it uses color in a way that’s not wrong but not effective either.
acs_county |>
  mutate(name = forcats::as_factor(name) |> forcats::fct_reorder(homeownership)) |>
  ggplot(aes(x = name, y = homeownership, fill = local2)) +
  geom_col(width = 0.8) +
  coord_flip() +
  labs(x = NULL, y = NULL,
       title = "Homeownership rate by location",
       subtitle = "US, Maryland, and Maryland counties, 2022")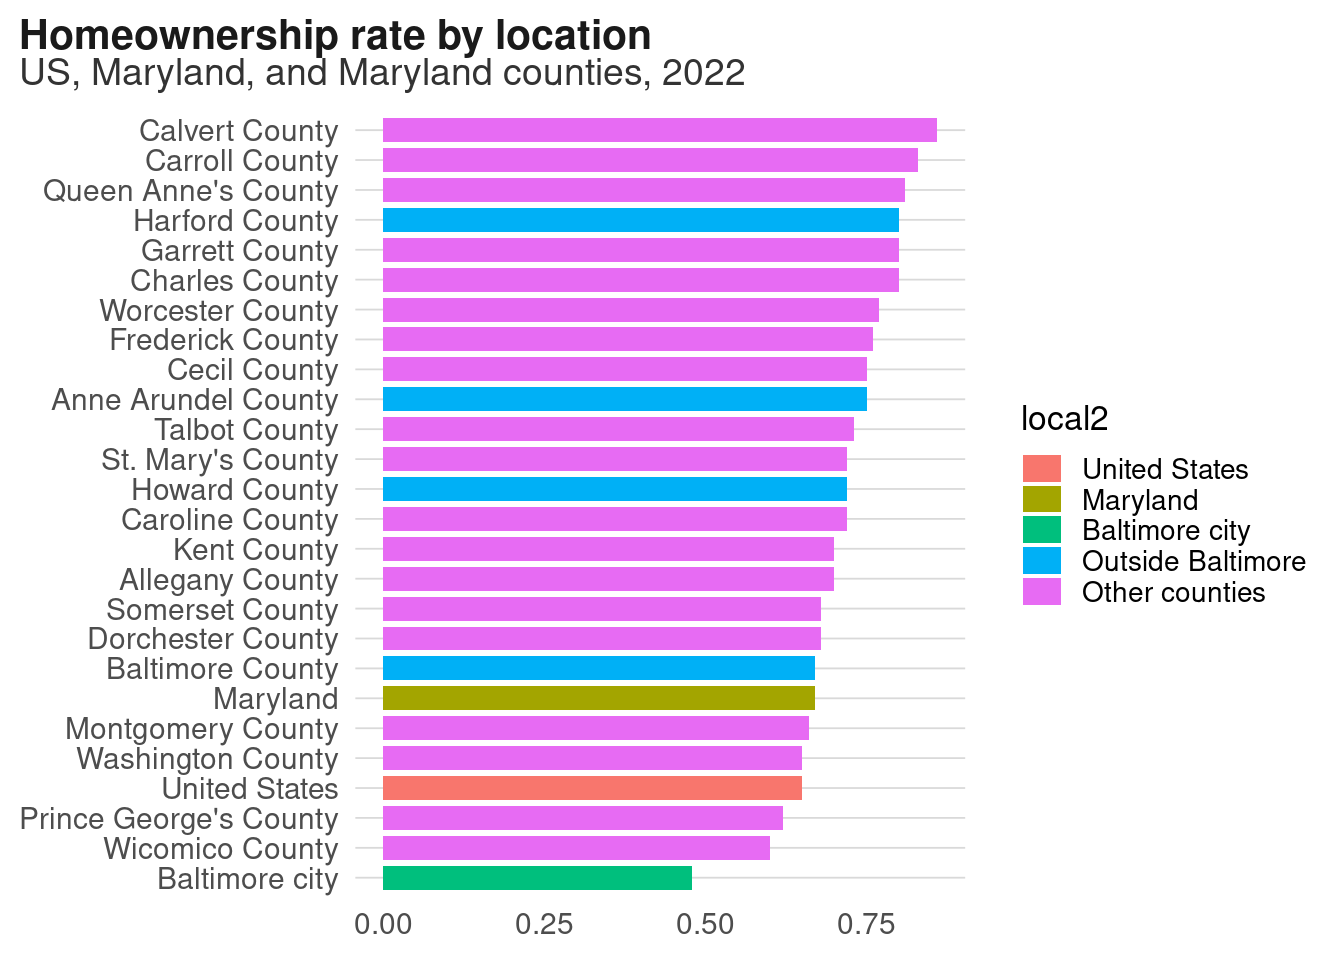
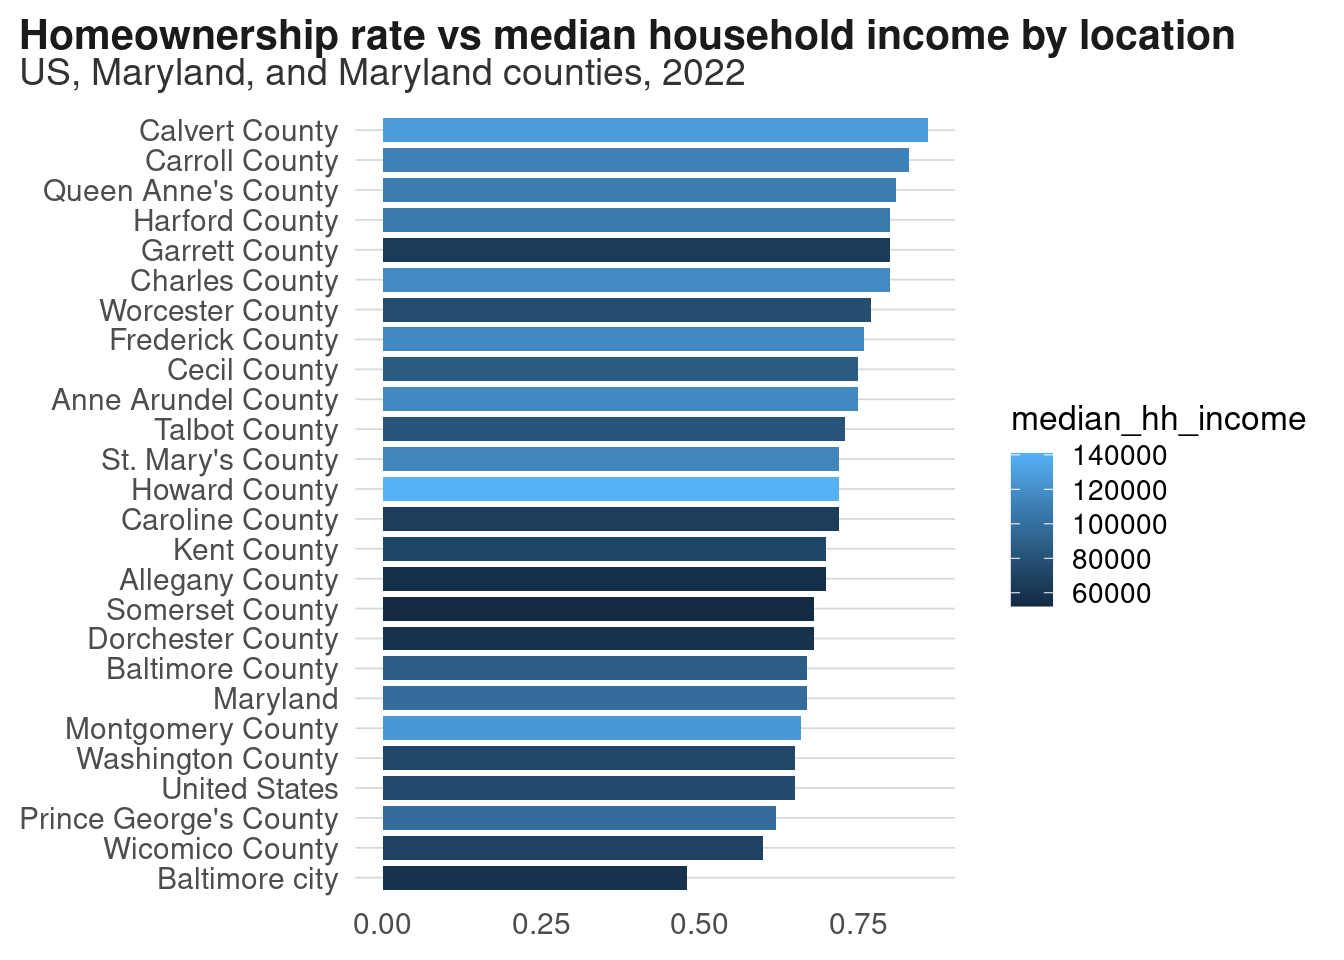
Here’s one that uses color when it should actually use something else to convey its pattern. What type of chart would be more appropriate?
acs_county |>
  mutate(name = forcats::as_factor(name) |> forcats::fct_reorder(homeownership)) |>
  ggplot(aes(x = name, y = homeownership, fill = median_hh_income)) +
  geom_col(width = 0.8) +
  coord_flip() +
  labs(x = NULL, y = NULL,
       title = "Homeownership rate vs median household income by location",
       subtitle = "US, Maryland, and Maryland counties, 2022")