As is the case with data visualization, it’s easy to find books with lots to say about maps without saying what a map is. A decent one, written for kids:
A map is a symbolic representation of selected characteristics of a place, usually drawn on a flat surface….Modern maps are tools people use to navigate, to communicate, and to organize information.
– National Geographic Society (2026)
One thing I like about this description of the purpose of a map is that 2 of the 3 main uses given (communicating and organizing information) would also be main uses of a nonspatial data visualization. Those tasks are then transformed by accounting for space.
A map is a model of a specific phenomenon in the real world—a communication device. You take an idea or an insight that’s in your brain and magically transport it into somebody else’s.
– O’Donohue (2020)
This is the list we brainstormed in the first class when we discussed how data visualizations are used. Which of these uses also apply to maps? What else should we add?
Just like many meetings should instead be emails and many charts should instead be bulletpoints, far too many maps should actually just be, at most, a chart. (or maybe a bulletpoint.) So again, having data that has locations associated with it doesn’t mean that you necessarily should make a map of it.
Andy Kirk uses maps as an example of why & how you should think critically about how to visualize your data:
Just because you have spatial data does not mean that the most useful portrayal of that data will be via a map. If the interesting insights are not regionally and spatially significant, then the map may not provide the most relevant window on that data. The composition of a map—the shape, size and positioning of the world’s regions—is so diverse, inconsistent and truly non-uniform that it may hinder your analysis rather than illuminate it.
– Kirk (2016) p. 216
I’ve been asked to make maps of phenomena that have little or nothing to do with geography, just because people like maps and maybe they have data with town or county names attached. Don’t make data viz decisions for the sake of being cute (or even necessarily because a client asked you to). Instead, like with using aggregates in place of finer-grained values, you might be trading away the specificity of your data or the accuracy with which it can be read.
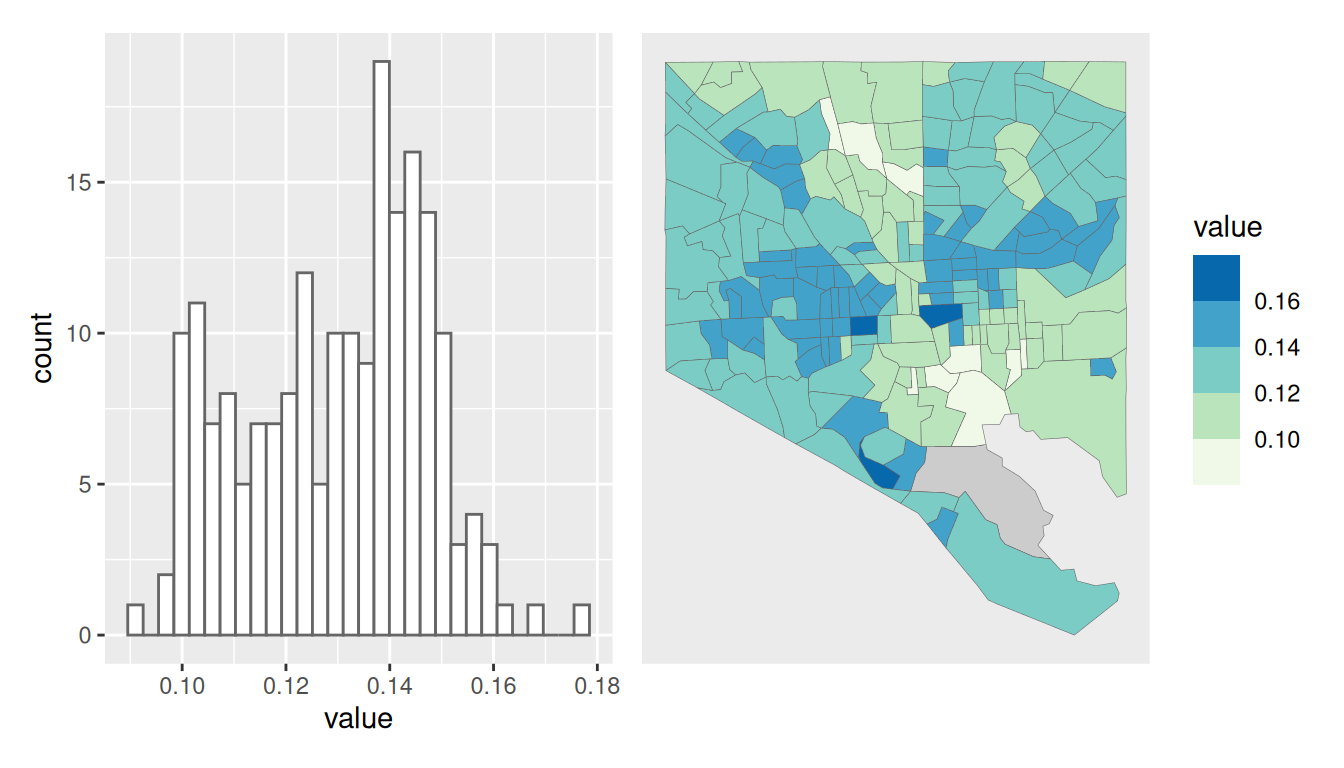
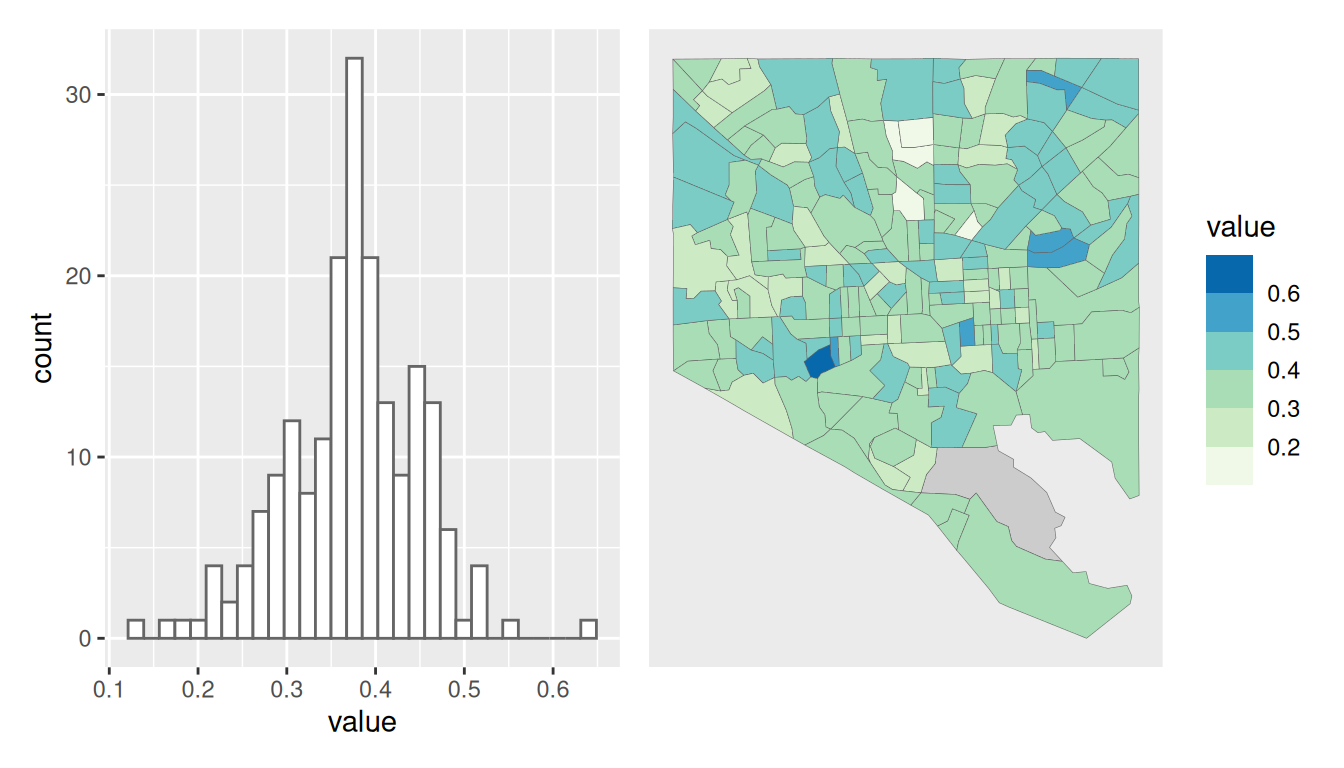
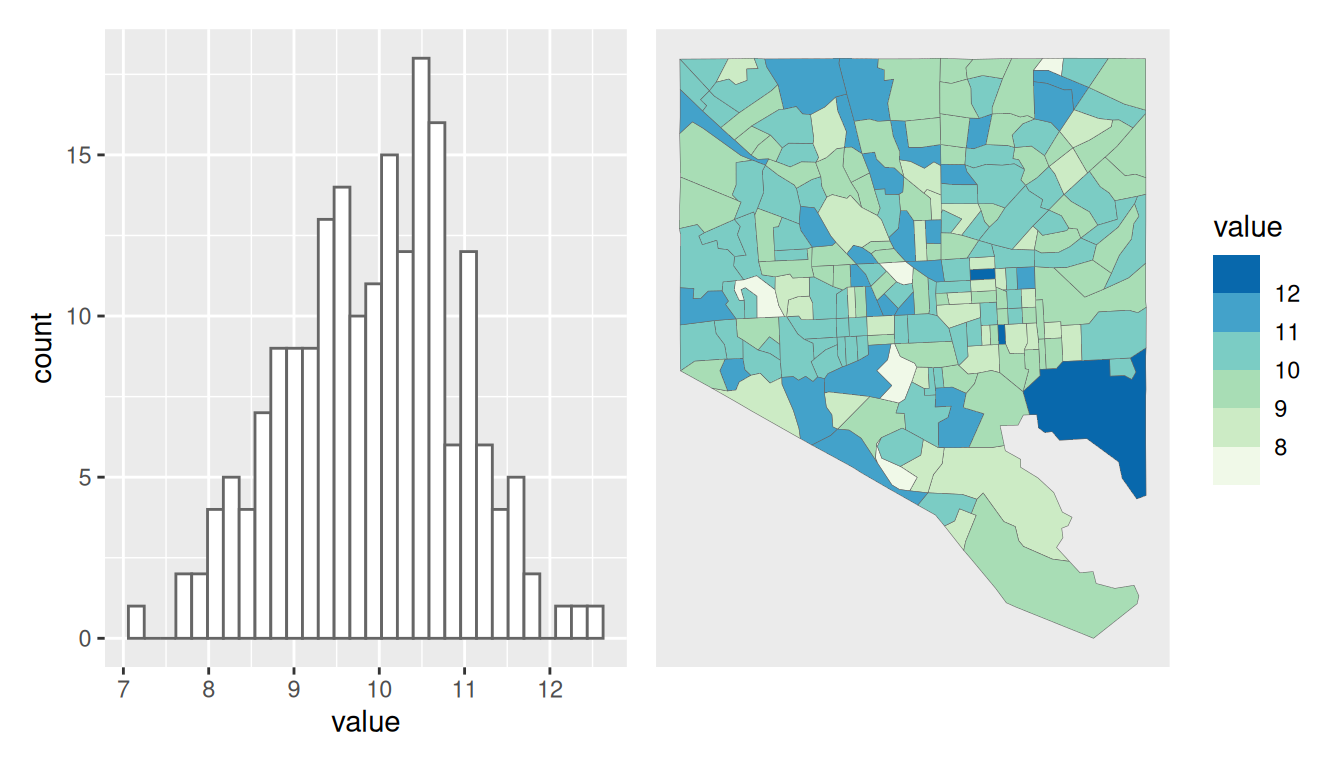
Here are a couple examples of where you might or might not want to make a map. For each pair of histogram & map, we’ll talk through the pros, cons, and best uses of each.
We’ll talk in more detail about the specific pros and cons of mapping data next week, but I think it helps to tease apart what your visualization’s purpose is and whether that purpose involves finding or understanding information specifically in space. If I need to know how many bus stops are in my neighborhood, I’d rather just see a few words of text that say there are X bus stops in neighborhood Y, or a bar chart of the number of bus stops for each neighborhood, than to be given a map where I have to find and count all the bus stops myself. But if my task is to figure out where those bus stops are, then a map is the right tool.
We also spent the first half of this course making decisions about how we show data and what aspects of data we assign to different visual encodings. Many of those things we could choose are now out the window with mapping. Think about some of the decisions we made, and figure out what, if anything, would be the correlary with a map:
I already said don’t make a map just for the sake of it, and I said not to to question whether you should make a map of data without a geographic pattern. However, sometimes your data doesn’t have a clear geographic pattern but your map’s purpose does.
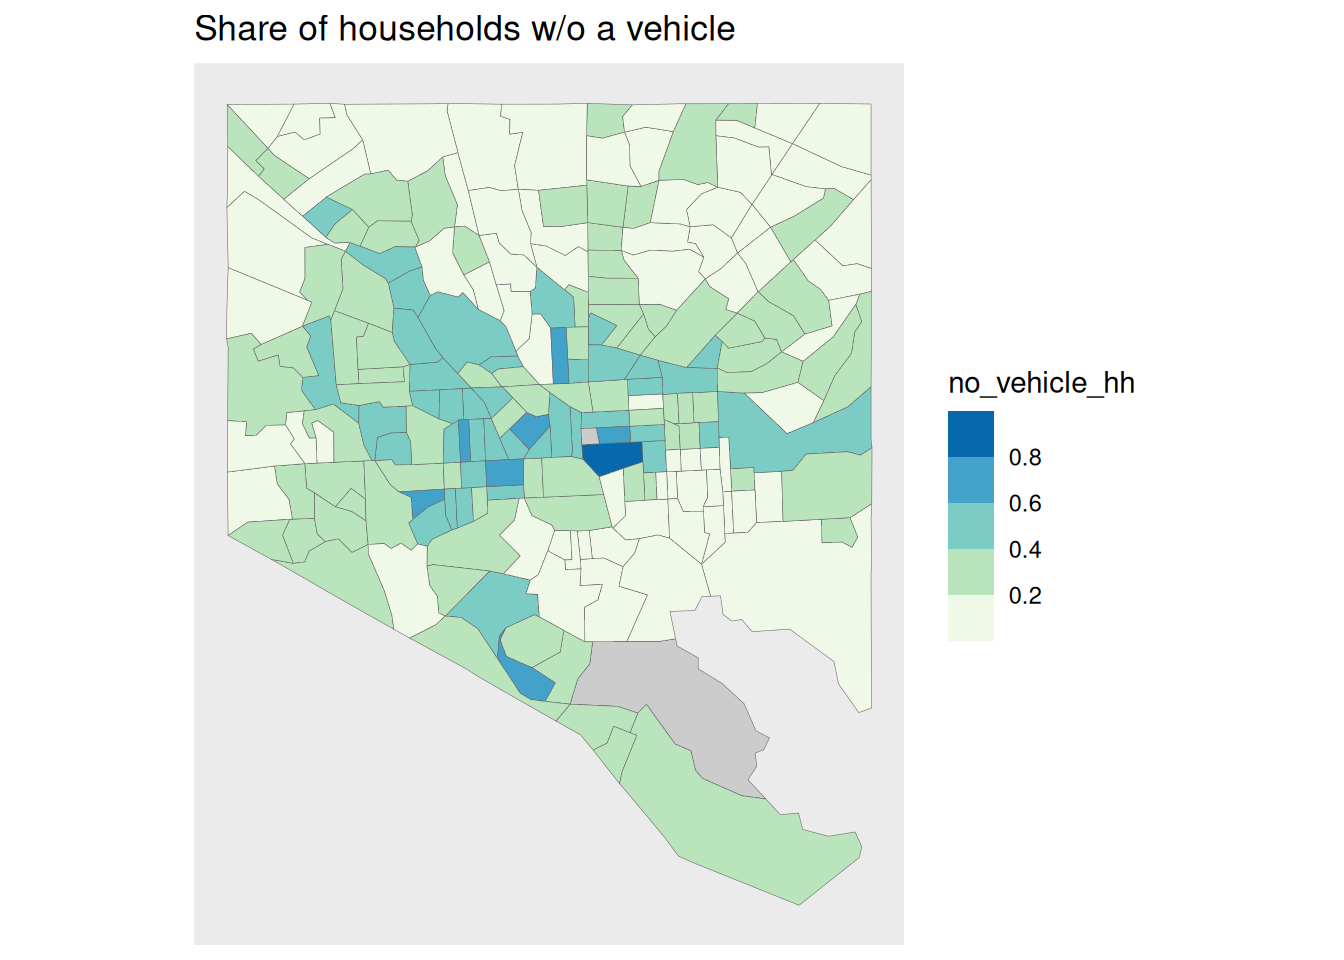
The percentage of households without a vehicle in Baltimore city does seem to have a geographic component, although it’s blocky in a way that we could probably divide the city in slices (Southeast, East, Northeast, etc) and make a bar chart of their averages and learn just as much. But we might be asked to make a map like this to help take some sort of action or plan a policy that will need to rely on geography. A map like this could be used to help decide where to target subsidized rideshare programs or to do something crazy like ACTUALLY BUILD THE RED LINE.
Or, you might be mapping two different things, neither of which have interesting spatial patterns on their own, but where their relationships to each other in space is important. I had a project helping a group focused on childcare, where I needed to make a map of all the childcare providers and all the bus stops in a small city. Neither of those would independently be very interesting—the bus stops were in predictable places every few blocks along main streets, the childcare providers were scattered, especially the family-based providers. But the analysis and policy question was how many providers were within two blocks of a bus stop, and that is an interesting spatial question. I still could have done something like calculate the distance between each provider and its nearest bus stop and made a histogram or bar chart or something, but that would miss the point. The point was to understand something about how manageable is it for a parent to take their kids to school or daycare on the bus, and what resources might make that less burdensome. For that parent, it very much is a spatial problem.
So as always, get to know your data and the purpose of your work, and use your best judgment.