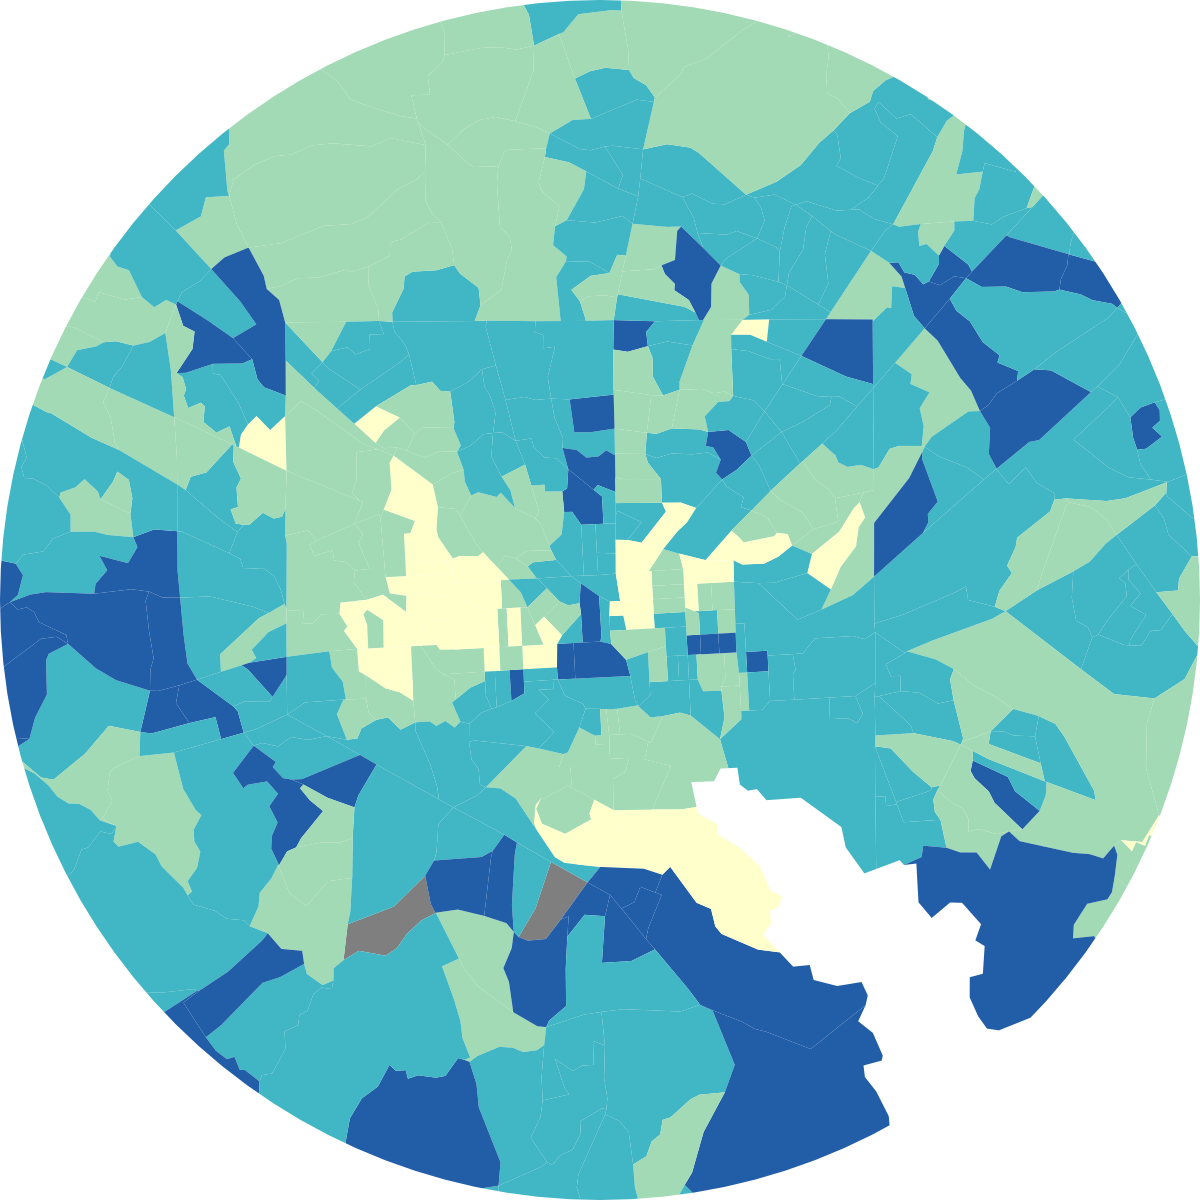
A dataset containing environmental health risk factors from the EPA's EJSCREEN environment justice index for census tracts in Maryland. Values are calculated based on aggregations of risk factors, then given as percentiles compared to all tracts across the US. Columns starting with "d" are adjusted for one of two different definitions of vulnerable populations.
Format
A data frame with 18879 rows and 5 variables:
- tract
Character. The tract FIPS code.
- indicator
Factor. The environmental health risk factor, such as proximity to water treatment or air pollution-related cancers.
- value_ptile
Integer. The nationwide percentile of indexed values.
- d2_ptile
Integer. The percentile of indexed values scaled based on a two-factor demographic index (percent low-income and percent people of color).
- d5_ptile
Integer. The percentile of indexed values scaled based on a five-factor demographic index (percent low-income, unemployment rate, percent limited English, percent without high school diploma, low life expectancy).
Source
Environmental Protection Agency (EPA) EJSCREEN Environment Justice Index. ~~Data portal, definitions, and methodology are available at https://www.epa.gov/ejscreen/technical-information-about-ejscreen~~ Removed in early 2025 from EPA servers by DOGE, but many people and organizations host backup copies. For this package, the data comes from an archive at Harvard Dataverse. EPA. (2024). Environmental justice mapping and screening tool (EJScreen) (Version 4.0) [Dataset]. Harvard Dataverse. https://doi.org/10.7910/DVN/RLR5AX
Examples
head(ej_natl)
#> # A tibble: 6 × 5
#>   tract       indicator           value_ptile d2_ptile d5_ptile
#>   <chr>       <fct>                     <dbl>    <dbl>    <dbl>
#> 1 24001000100 pm25                          7        8        9
#> 2 24001000100 ozone                        11       11       12
#> 3 24001000100 diesel                       15       17       17
#> 4 24001000100 toxic_air_release            44       41       51
#> 5 24001000100 traffic                      13       15       15
#> 6 24001000100 lead_paint_exposure          61       53       63